(A Mechanism for Earth Expansion – Part 2)
© Peter Woodhead
(
peterchapel@googlemail.com
This e-mail address is being protected from spam bots, you need JavaScript enabled to view it
)
and
Andrew Johnson (
ad.johnson@ntlworld.com
This e-mail address is being protected from spam bots, you need JavaScript enabled to view it
)
March/April 2015
Video Discussion
Introduction
Following our previous article/posting “
A Mechanism for Earth Expansion”, it is the intention of this article to offer corrections and additional material in support of the theory of
Gas Powered Planetary Expansion.
Serendipitously, on the same day as a
related video was posted by us,
new research was published in the New Scientist 12th June 2014 edition, in an article entitled “Massive 'ocean' discovered towards Earth's core”. This research received
considerable exposure in
other publications,
although research from approximately 7 years earlier was not mentioned.
In our original article and video, a challenge was made to the seismologists regarding the real nature of the earth’s internal structure. This challenge was made because it is generally concluded, even before the appearance of the latest research about “underground oceans,”
that at least part of the core is liquid iron. We suggest that the core is actually gaseous – mainly steam, and around this sits a layer of water, heated by one or more processes happening in the earth’s crust, which is above it.
An Ocean Towards the Earth’s Core?
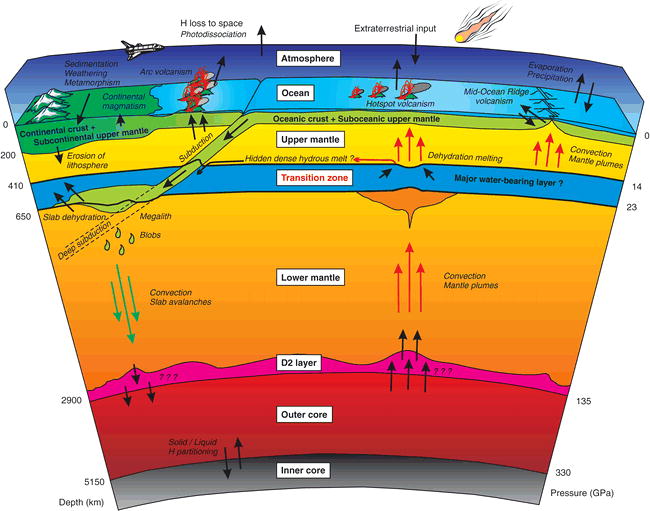
This model suggests much less water would be present than in the Gas-Powered Earth Expansion (GPEE) model. However, a small amount of water does not seem to negate the GPEE model altogether - as has been previously stressed,
steam expands to many times the volume of the water it is formed from, so it can be calculated that enough water will be still available based on the suggested depth and thickness of the transition zone shown above.
Ringwoodite and “Slush”
In the earlier article and video, we proposed that there was a layer of what we called “slush” – some kind of material which was not quite water, but was not ice. We also calculated the volume of water in the inner earth, based on the figures we had suggested then. Now, with the new/additional information about the proposed Ringwoodite layer, we can improve these calculations.
In the new study, a type of rock called “Ringwoodite” (of which we were previously unaware) was mentioned. This is contained in the “water bearing” layer (Transition Zone) – shown in dark blue – in the diagram above.
Ringwoodite would be undergoing an expansion of its own, as the 5% or so of water is heated and released into the earth’s gas core.
The depth and thickness of the Transition Zone, as shown above, are 410km and 240km respectively. Radius of “bounding spheres” would then be 6370 - 410 = 5,960 and 6370-650 = 5,720km. Assuming a uniform thickness of this zone around the earth, the volume of this zone would be given by:
0.068 x 1.03 x 1011 = 7.02 x 10⁹ km3
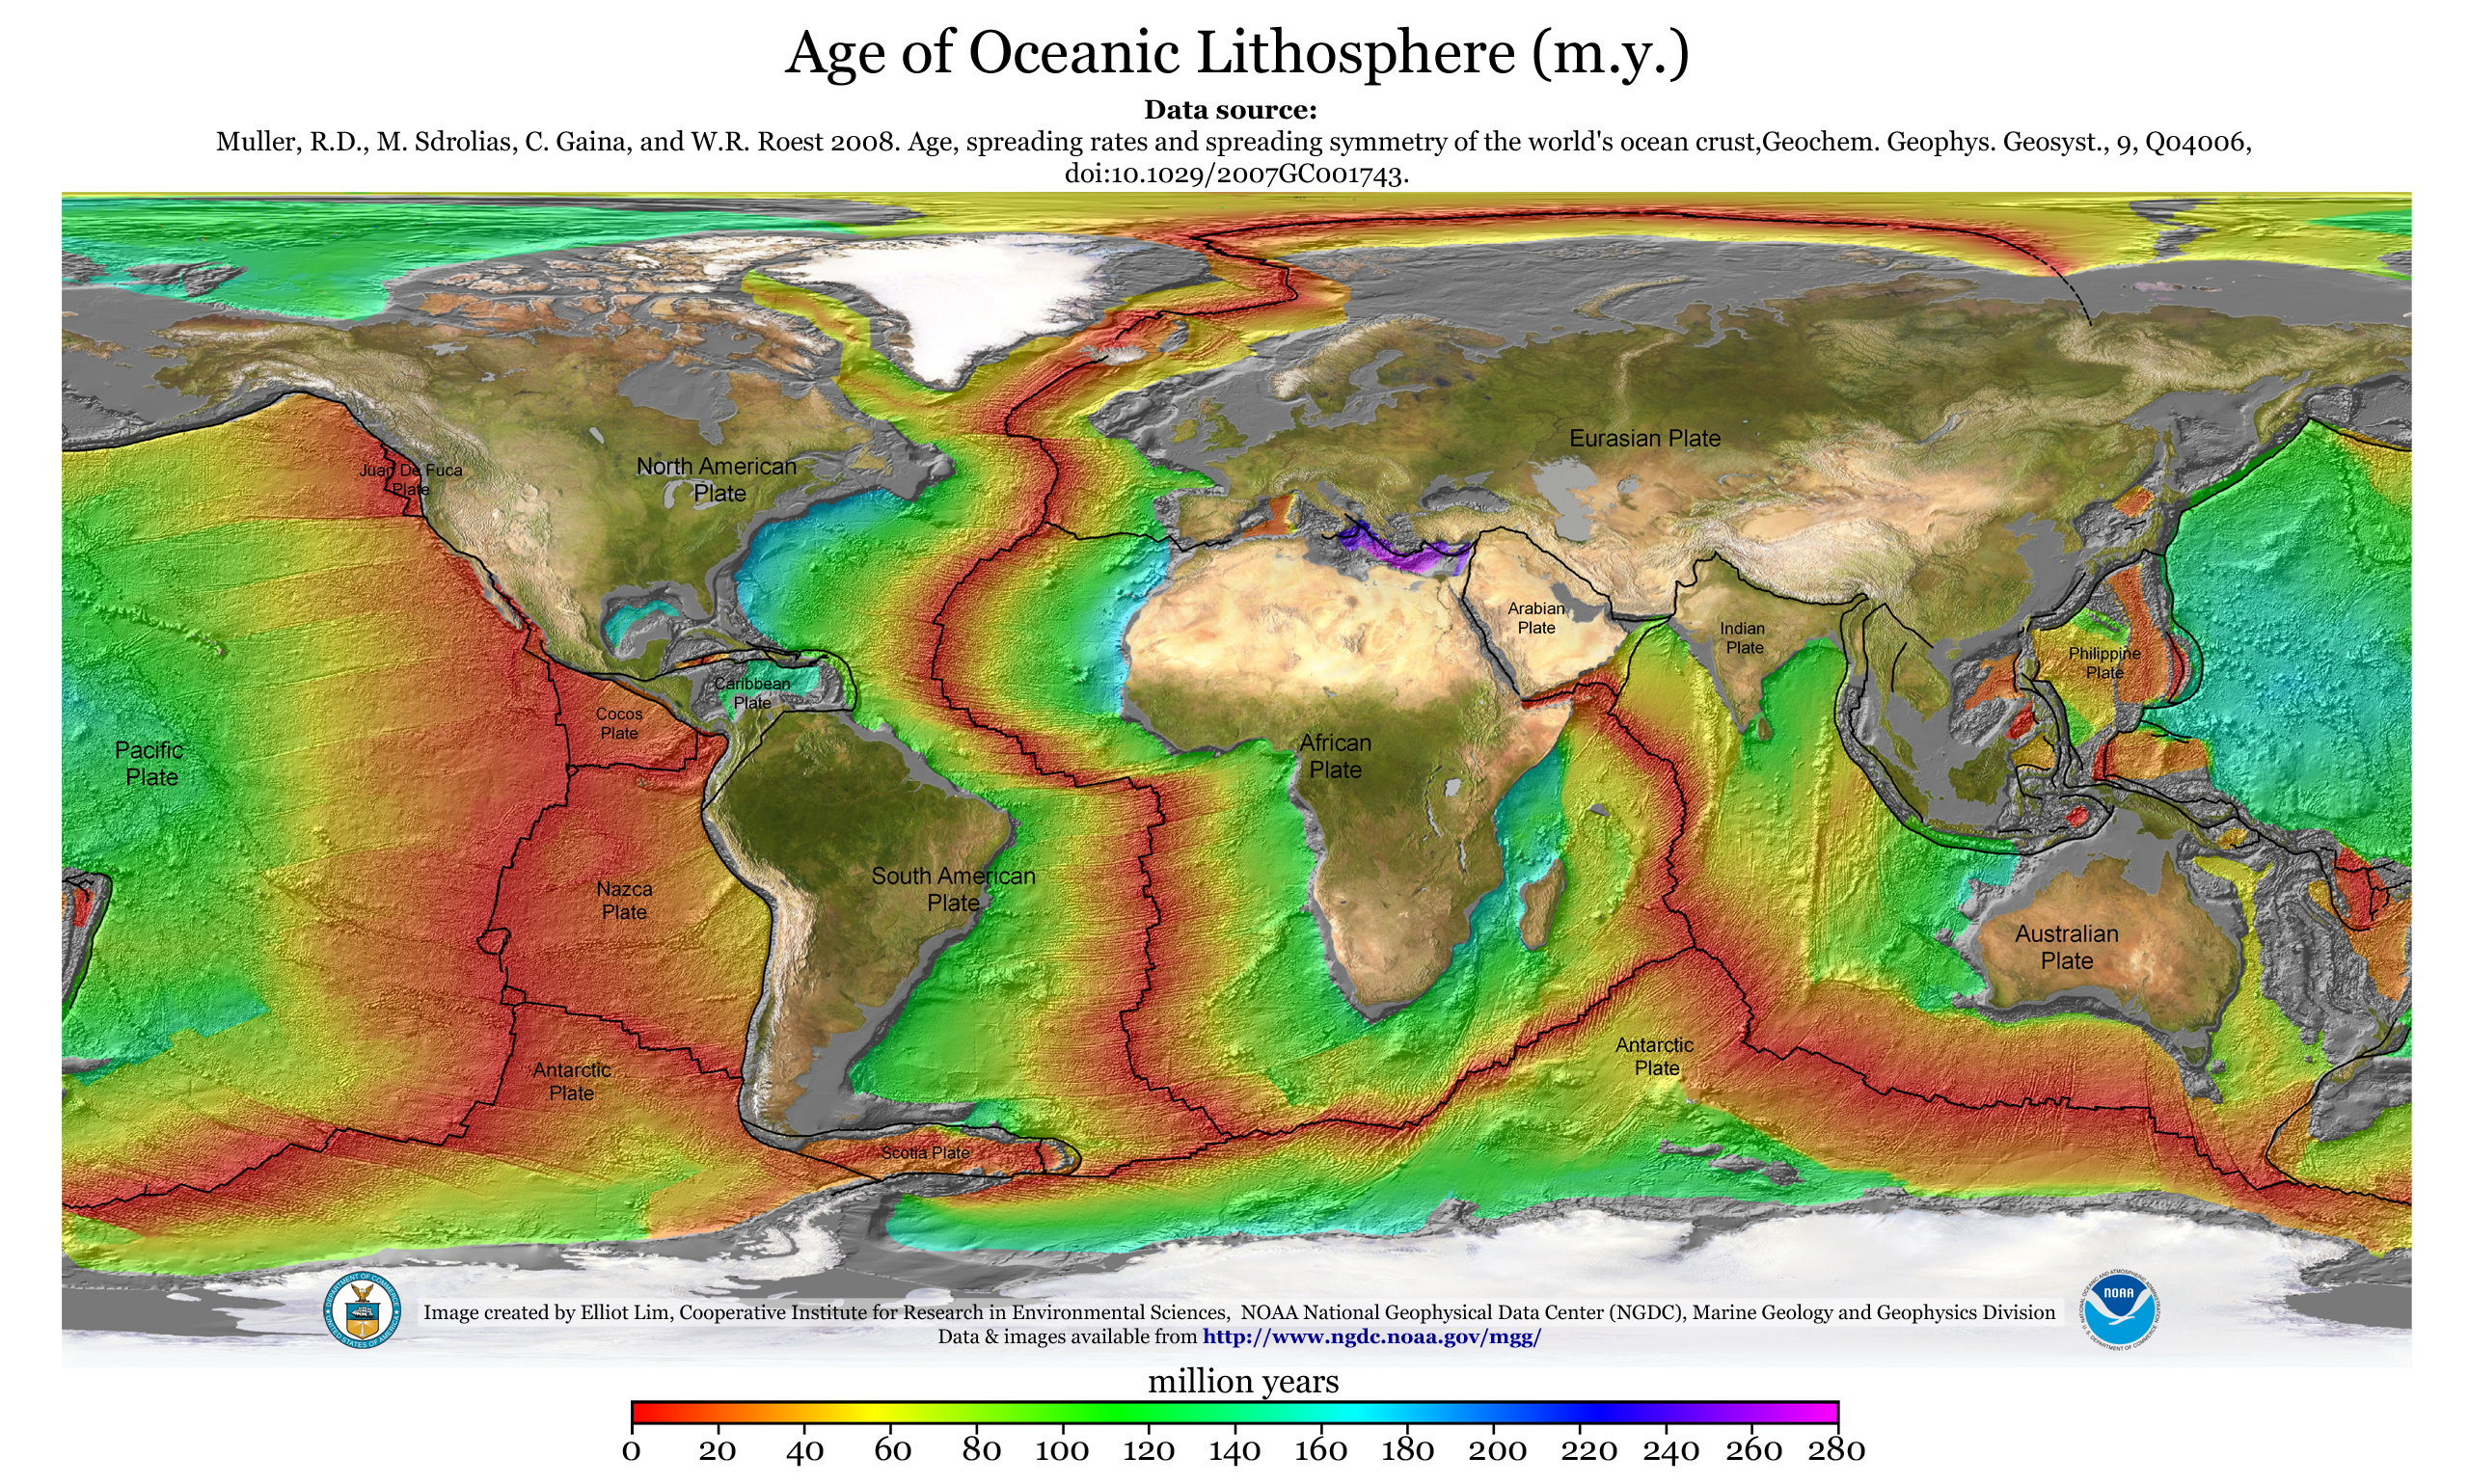
One thought to consider regarding the origin and formation of the oceans is the age of the bed of the Mediterranean Sea (
shown on the “rainbow” ocean floor map). Could the first out-welling of basalt and water have occurred with “venting” from below the mantle in this area? Could that venting have been initiated by a meteoric or cometary impact? Perhaps further study of geological features may reveal more about this possibility.
An additional question, then, would ask why the ringwoodite contains the water in the first place – how did it from down there below - all the hotter mantle material, if the accepted model of a hot/molten core is correct…?
Surface Gravity and Centre of Mass Force
When the first article on this subject was published by us, it was inevitable that some estimates were made, including assumptions about the quantity of subterranean water and the depth to centre of gravity in the crust. We have here attempted to make a better estimate for some of these figures, but we are still dealing with many variables and unknown quantities. However, we have also attempted to look at other related figures in an effort to improve and/or validate these estimates.
It became clearer that available evidence did not support the previously stated 300 km depth of the earth’s Centre of Gravity, or “Centre of Mass Force” as we have come to call it. The 300 km figure came about as a result of calculations that were over simplistic. Therefore, several attempts were made to formulate a means to calculate the surface gravity of a spherical shell, of uniform thickness. The method used was to consider the gas-filled earth being split into a number of segments, and consider the force of gravitational attraction on a mass at the surface. The following 2 diagrams are possible ways of visualising this:
Each segment exerts a force on masses on the surface. In the diagram above, the horizontal forces cancel each other out, but the vertical forces are additive. This is a kind of 2D-visualization. An enhanced 3D visualization is shown below.
m1 is a mass on the surface, which is attracted by the mass in all of the mass of the earth
m2 is a ring/shell. The volume of the shell is given by the area x thickness of ring and this is therefore proportional to the mass. The vertical force is proportional to sin θ where θ is the angle of the line of force measured perpendicular to the equatorial diameter, D above.
The Shell Theorem
Some people will immediately point out that “
the gravitational force will still act as if it is at the centre of the earth – even if the earth is hollow or gas-filled!”
They will point to examples like this one:
|
|
|
Such a shell can be envisioned as a stack of rings.
|
Field Outside a Massive Spherical Shell
|
It is hardly surprising then that, in researching a method for calculating the CMF more accurately, we became aware of Newton's Shell Theorem,
which is stated thus:
Newton's Shell Theorem states essentially two things, and has a very important consequence. First of all, it says that the gravitational field outside a spherical shell having total mass M is the same as if the entire mass M is concentrated at its center (center of mass). Secondly, it says that for the same sphere the gravitational field inside the spherical shell is identically 0.
Where, and how, does the Newton Shell theorem (NST) place the CMF at the sphere COM? It doesn't. The question of locating the CMF is not discussed! The NST model begins with a ring on the sphere of differential mass dM oriented perpendicular to m and centered on r. By summing the force for each dM on each ring then integrating over the surface of the sphere, the total force, F = GmM/r^2 results, which says nothing, absolutely nothing, regarding the location of the CMF.
Another poster (unsurprisingly) responded:
the result of the integration is:
which is exactly the same equation you would get if all the mass were at the center. how can you possibly not understand that?
Further discussion ensued, but posters did not seem to accept the validity of the question. For example, if “the force acts from the centre,” then would it not be the case that there should be no gravitational anomalies as measured from the surface?
Intuitively, when you look at a diagram showing an object in contact at the surface with the shell, it seems unlikely that the mass of the far hemisphere can exert the same force on the object as the near hemisphere. To establish where this CMF might be for the expanding earth, a spreadsheet was developed. We realise that to produce a more accurate figure for the CMF distance, we need a revised version of the calculations which are shown in the “Field Outside a Massive Spherical Shell” example above. We need to use integration, but that level of maths is beyond us at the moment.
With the above equation, it is assumed that the centre of mass is at the centre of the earth. R is the radius of the earth – which is the same as the distance to the assumed centre of mass.
With a hollow or gas-filled shell, the centre of mass attracting a mass on the surface, would not be at the centre of the earth – the mass of shell would be closer to the mass on the surface. Hence, the effective R would be smaller than the radius of the earth (Rc < Re).
It is therefore possible that the mass of the earth is actually much smaller than the accepted figure, so when divided by a smaller r2, we get the same overall resulting force at the surface...
CMF Calculations
A more accurate result could be determined by considering the earth's different layers (which, according the GPEE model would be lighter material as you descend). The actual distance to the CMF is proposed to be at around 1993 km - determined by using the spreadsheet calculations.
A similar spreadsheet created using pre-expansion/solid earth statistics puts the CMF at a depth of 3764 km – close to pre-expansion earth’s centre. Therefore, gravity at the pre-expansion earth's surface would be roughly 23% of that today if we use depth to CMF 1993 km (gravity measurement derived) and 36% using the a CMF depth of 2250km. This would therefore allow us to explain why the large flora and fauna existed on a pre-expansion earth with a surface gravity 25% of what it is today.
Gravity Anomalies at Altitude
In considering the force of gravity when on a high mountain, one might consider it can be affected by 2 factors.
a) The force of gravity would be slightly reduced by being further away from the centre of the earth
b) The force of gravity would be slightly increased by having “dense hard rock” beneath you.
A regional trend in the Bouguer field is determined for an observed eastward decrease in crustal thickness based on seismic refraction measurements. A comparison of the calculated regional with surface boundaries shows that in places the crustal thinning occurs more than 50 kilometers west of the Inner Piedmont-Charlotte belt transition.
Could this “crustal thinning” be a result of the gas-filled structure of the earth? The differences in crust thickness would, arguably, have a much more significant effect on the local force of gravity, due to the reduced distance from the surface to the centre of mass force.
The Nevado Huascarán summit (Peru) with an estimated acceleration of 9.76392 ms-2
Using the
afore-mentioned webpage, we would expect to find the acceleration due to gravity to be, 9.7814 ms
-2 -a reduction of 0.32%
If we were to suggest this was the result of the CMF being at 1993km depth, we can calculate the expected change as follows.
This study identifies the places with the highest and lowest gravity acceleration:
A candidate location for Earth’s maximum gravity acceleration was identified - outside the SRTM area, based on GGE-only – in the Arctic sea with an estimated 9.83366 m s-2. This suggests a variation range (peak-to-peak variation) for gravity accelerations on Earth of about ~0.07 m s-2, or 0.7 %, which is about 40 % larger than the variation range of 0.5 % implied by standard models based on a rotating mass-ellipsoid (gravity accelerations are 9.7803 m s-2 (equator) 9.8322 m s-2 (poles) on the mass-ellipsoid, cf. Moritz [2000]). So far such a simplified model is also used by the Committee on Data for Science and Technology (CODATA) to estimate the variation range in free-fall acceleration on Earth [Mohr and Taylor, 2005]. However, due to the inhomogeneous structure of Earth, presence of topographic masses, and decay of gravity with height the actual variations in free-fall accelerations are ~40% larger at the Earth’s surface
Could some of these anomalies be explicable by the CMF being in a position other than the core of the earth? If we take the highest and lowest stated figures for g, we can explain the total variation measured fits well with the calculation made above i.e.:
9.83 (Arctic Ocean) - 9.76 (Nevado) = 0.07 ms-2 variation
0.07/9.81 = 0.0071 = 0.7%
In a paper entitled “Specific Gravity Field and Deep Crustal Structure of the ‘Himalayas East Structural Knot’”, a number of Gravity readings are shown in Figs 5, 6 and 7 (Fig 7 is shown below). When first discovered, the survey of the Tibetan plateaux was very exciting, it seemed to point to a 0.1% reduction in g for an increase in altitude of 1,000 metres. That would have supported a depth to CMF of around the 1993 km mark giving a value for g atop Everest of 99.1% of that at sea level. However, the stated gravity figures were not actual measurements but were "calculated". Since we do not know how they were calculated we could not determine what the actual measurements were. So, we did not have any measurements to corroborate the proposed 0.1% drop in g per 1,000 metres, it was then realised that the figures actually pointed to a drop of just 0.01 mGals per 1,000 metres, that would give a drop in g atop Everest of just 0.09%, less than a third of the 0.28% reduction calculated from the accepted "solid" earth model. Until we gain some actual "weight" readings at altitude this will remain a puzzle.

These and similar studies tend to explain these anomalies by inferring that beneath the mountain areas were areas of “less dense substrate”, also that under the low altitude areas lay “much denser substrate”. We would argue that the reductions are more significant because the CMF is closer to the surface than is accepted/used in the calculations.
We would like to appeal to anyone who would be able to take weight measurements at high altitude – e.g. anyone who lives in the Rockies in the USA or anywhere in a mountain range and is able to weigh a 100g or 200g weight at sea level and then go to as high an altitude as possible with
a sensitive weighing scale and weigh the same weight and compare the results. (This was tried on a holiday flight at approx 10,000m but the aircraft was simply not stable enough to give a usable reading.)
Angular Momentum
Since part 1, additional (simple) calculations were done to consider the earth’s angular momentum and the current day length. From this, the approximate length of the earth’s day in the time of the dinosaurs can be calculated. Similarly, the equatorial centripetal force can be calculated, but this is essentially negligible. These figures are shown below. So this does not really “factor in” as an explanation for the gigantism of flora and fauna.
MYA
|
Day Length (Hours)
|
Equatorial Centripetal Force (N/kg)
|
300
|
8.38
|
0.16
|
250
|
9.09
|
0.14
|
200
|
9.86
|
0.13
|
150
|
10.95
|
0.11
|
100
|
13.07
|
0.08
|
50
|
17.03
|
0.06
|
10
|
21.29
|
0.04
|
0
|
24.00
|
0.03
|
“It’s Only Rocket Science”
During one of NASA's early ventures into space – the
Explorer 1 mission (which is regarded as the mission which discovered the Van Allen Zones), something unusual happened. The probe was launched and was tracked by Cape Canaveral and Goldstone (Australia).
However, it “arrived” in the expected location about 12 minutes late. This seems to have been because its orbit was higher than was planned – by a considerable margin. One explanation for this is that the force of gravity reduced much more rapidly than expected with increase in altitude. If there are any experts in orbital mechanics out there who have worked on space missions and know of any “fudge factors” that may be applied in calculations, we’d love to hear from them!
International Space Station
If the CMF is indeed at a depth of, say, 1993 km and not 6378 km as we are led to believe, we should consider how will this affect the orbit of satellites and how it will affect near-earth space missions. As a spacecraft gets further away from the earth, the difference in the calculations between a hollow and a solid earth will be less and less significant – once we are, say, 1 or more earth radii away from the earth itself.
Let us say that the CMF is at a depth of 1993 km and earth's mass is 7.45 x 10²³ kg, as arrived at using GPEE theory and not a depth 6378 km and earth's mass at 5.97 x 1024 kg as is currently accepted. The following calculations show that using a mass of the earth based on GPEE theory, combined with a distance to the CMF as proposed in this document could have exactly the same force of attraction as a lager (i.e. the currently accepted) earth mass and the accepted distance to the centre of earth.
The centripetal force on an object in circular motion is given by
To calculate the force of gravity on ISS, we would then do the following calculation
This force would be equal to the centripetal force, T shown above, caused by ISS’s orbit. What is proposed, then, is that the calculation can be done, instead with the following values
As was stated earlier, one can suggest that if the mass of the earth is different to the accepted value, and the centre of mass force is not actually at the centre of the earth, the overall force of gravity would work out to be the same. Similar calculations can also be done using Kepler’s 3rd Law and the appropriate values for the accepted mass and radius of the earth, compared to the new (lower) suggested earth mass and distance to the CMF.
Celestial Bodies “Ringing Like Bells”?
Earthquakes
The GPEE theory also therefore could explain this situation - since the crust is brittle and the transition zone, ringwoodite with liquid water within will also be brittle, the zone between (mostly magma) viscous.
It has also sometimes been said that the earth
can “ring like a bell” when an earthquake happens. Does this imply, then, that the earth really does have a shell-like structure – with a large void at the centre?
One quote reads “The Earth rings like a bell after a large earthquake – the lowest ring tone is E flat in the 20th octave below middle C (Source: F Press and R Siever, Earth, New York: Freeman, 1986, p 467).”
Another quote is “Seismic waves from the biggest earthquakes (over magnitude 8.3) can bounce around inside the earth for up to a month. This makes the earth "ring". However, you need special instruments to hear the ring because the tone is very low — about 1 cycle per hour. Compare this with the 256 cycles per second of middle C on the piano.”
Though seismologists would argue this effect happens because of the difference in nature between the inner and outer core of the earth etc, the comparison of “shell structure” to a bell seems to hold at least some merit. This might also add weight to the suggestion that the earth does indeed have a physical “resonant frequency” – as is perhaps implied by the quotes above.
Moonquakes?
Knowledge of Lunar Interior Structure. Like Earth, the Moon has a crust, mantle, and core. The lunar crust is rich in the mineral plagioclase and has an average crustal thickness of 60-70 kilometers, which is about 3 times the average crustal thickness on Earth. The lunar mantle lies between the crust and the core and consists mostly of the minerals olivine and pyroxene. The core is probably composed mostly of iron and sulfur and extends from the center of the Moon out to a radius of no more than 450 kilometers; i.e., the core radius is less than 25% of the Moon's radius, which is quite small. In comparison, Earth's core radius is 54% of Earth's radius. However, the size of the lunar core is not well constrained by existing seismic observations. Better constraints come from the laser ranging retroreflector and magnetometer experiments.
Though planetary scientists may object, we can suggest, that like other bodies orbiting the sun, the Moon could also have a gas-filled centre.
Formation of the Earth and the Moon
Though this remains a mystery, most agree the moon and the earth formed at the same time (however, we have to note that a smaller number argue that the moon arrived much later, with some people going so far as to say the moon is manufactured –
a giant space station even).
For the moment, we will suggest the earth and moon were originally two spinning globes, moving in a figure of eight formation, with opposite directions of rotation. Whilst remaining cold, their fast rotation would continue - for perhaps 4 billion years or more – all the while their cores being heated by induced currents from the Sun’s electric field and radioactive heating in the crust (shell). During expansion, conservation of angular momentum would mean the rotation of each body would slow down. The viscosity of the moon’s interior would be greatly influenced by the earth’s gravity and would be ever more drawn to the earth, like an inner tide, slowing the moon’s rotation – eventually to the “tidal locked” situation we have now.
Could the tidal locking lead to an inner anomaly in the thickness of the moon’s shell? This may then lead to a different force of gravity on the earth-facing side of the moon compared to the far side.
Moon’s Shell Thickness and Centre of Mass Force
We are considering here that the moon may be like the earth and have a gas-filled core.
If earths mass is not the accepted 5.97 x 1024 kg but is 6.47 x 10²³ kg, then it is roughly 11% (10.8%) of the accepted mass. If we apply the same logic to the moon’s mass, then the moon’s mass will be
7.35 x 1022 kg x 10.8% = 7.93 x 10²¹ kg
We will use a density for the moon equal to that assumed for earth - 2.9 kg/l. We can then calculate the volume of material in the shell, based on the new mass calculated above. First, we calculate the density in kg/km3 as 2.9 x 10¹² kg/ km3. Hence, the volume of material in the shell would be given by:
Vshell = 7.93 x 10²¹ ÷ 2.9 x 1012 = 2.73 x 10⁹ km3
We would argue, then that this is the material that makes up the “shell.” So, the volume of the interior is given by subtracting V
shell from V
moon.
The moon’s accepted volume is about 2.2 x 10
10 km
3 hence:
Vinterior = 2.2 x 10¹⁰ - 2.73 x 109 = 19.27 x 10⁹ km3
Using the Vinterior figure, we can now calculate the radius of the interior as
The moon’s average radius is 1737 km therefore the moon’s shell is
1737 - 1663 = 75 km thick
Proposed Structure of the Moon
Having assumed earth's tidal drag on the moon (over time), forced its rotation to become locked, it would seem reasonable to believe the moon's mantle (while still being liquid) would be drawn (a little) to the earth facing (near) side For this reason the spreadsheets were modified to taper the moon's shell thickness from 73 km on the far side to 78 km on the near side.
Hence, based on this idea and these figures, the gravitational force of attraction on a low lunar orbit orbiter at, say, 75 km above the moon's surface change by about 5% between the far to near side. A variation of 5% per orbit would necessitate frequent fuel sapping corrections to avoid the decay of its orbit.
A CMF depth of 838 km “far-side” and 814 km on nearside (a 24 km difference) could be enough to cause insurmountable complications to maintaining lunar orbits – especially in the early days of exploration.
Lunar Probe Missions in the 1960’s
Wikipedia (for all its faults) has a
useful list of lunar probe missions. Inspection of the outcome of these missions would not have given Apollo Astronauts much confidence in their own endeavours. For example, all the missions in 1958 and in 1962 and 1963 failed. Even in 1969, all but one of the USSR missions failed (there were no USA Lunar probes launched in 1969).
We have already considered the possible effect of a different Centre of Mass Force on the Explorer 1 probe. So, whilst one could easily argue that most of these failures were due to the fact that these missions all took place in the “early days” of space exploration, what if a proportion of the failures were due to calculations based on incorrect assumptions about the variation of the force of gravity when going into orbit around the moon? Did scientists eventually learn to add in “fudge factors” to make sure the probes went into the right orbit?
In 2006, NASA published an article called “Crash Landing on the Moon” which states:
Crashing was much easier than orbiting, they discovered. The Moon's uneven gravity field tugs on satellites in strange ways, and without frequent course corrections, orbiters tend to veer into the ground.
Further Lunar Considerations
In considering the GPEE theory, let us assume that the moon formed in the same accretion zone as earth. Imagine the two spinning bodies of similar composition. The moon would, over time, undergo a similar evolution as previously described i.e. heating, expansion and venting, with an emphasis on venting, as the moon influences our seas, and by implication, any subterranean water. The earth’s influence on any subterranean water on the moon would be significantly greater.
Lunar Seismic Activity
Again, this is mentioned because it is possible that the moon, too, is undergoing gas powered expansion – which could explain some of what are known as
Transient Lunar Phenomena. For example, in 1968, a document was published called “
NASA Technical Report R-277.” Perhaps some of these phenomena were caused by the effects of expansion. Also, Lunar Reconnaissance Orbiter discovered evidence of
recent volcanic activity.
A view of Earth's moon looking south across Oceanus Procellarum, representing how the western border structures may have looked while active. The gravity anomalies along the border structures are interpreted as ancient, solidified, lava-flooded rifts that are now buried beneath the surface of the dark volcanic plains, or maria, on the near side of the moon.
Maria
In October 2014, new discoveries about very scale large geological features were reported e.g. Space.com reported “
Strikingly Geometric' Shapes Hidden on Moon's Surface” Could these be the result of gas-powered expansion, which on earth has resulted, ultimately, in the formation of continents? Further,
An ancient asteroid impact was thought to have created moon’s Ocean of Storms. Now scientists think it formed via processes within the moon itself.
This is a composite image of the lunar far side taken by the Lunar Reconnaissance Orbiter in June 2009, note the absence of dark areas.
It is true that there are very few maria on the far side of the moon. Could it be that the fluid or material that caused the dark colouration of the maria came from a fluid-bearing layer – like that proposed as being below the mantle? Again, this fluid may have had more of a tendency to erupt or exude on the side of the moon which faces the earth, due to the stronger tidal forces and difference in shell/crust thickness.
Tidal Locking
Most people seem to know that the Moon's gravity affects the Earth's oceans – but then obviously, the Earth's gravity also affects the Moon. It distorts the Moon's shape slightly, squashing it out so that it is elongated along a line that points toward the Earth. We say that the Earth raises "tidal bulges" on the Moon.
The Earth's gravity pulls on the closest tidal bulge, trying to keep it aligned with Earth. As the Moon turns, feeling the Earth's gravity, this creates friction within the Moon, slowing the Moon's rotation down until its rotation matches its orbital period exactly, a state we call tidal synchronization. In this state, the Moon's tidal bulge is always aligned with Earth, which means that the Moon always keeps one face toward Earth.
A very interesting use of language “tidal friction”, we are well aware of the moons tidal effect on our oceans and the effect is demonstrable. We note this phenomenon here, as it seems reasonable to suggest that if there is indeed a layer of water beneath the crust of planets and planetoids, it could help to partly explain why this situation arises as it does not seem as easy to attribute the effect to so called “solid bodies”
Coal and Abiotic Oil
As well as earth expansion, we can thank our “gas/steam” powered core for the creation of oil, in a process known about for well over a hundred years “abiosis.” Methane, forced through earth's crust by the immense pressure from earth's core, in combination with steam is transformed to the “black gold”.
Again one might argue that the conditions for formation of coal could be created by the steam and pressure derived from a gas-powered earth expansion process.
Dark Matter and the Electric Universe
So, if the mass of the earth is, say 10% of the accepted figure, other masses, derived from that of the Earth will also be 10% of their accepted size.
Could this mean that there is no need to “invent” dark matter…?
Subterranean Oceans
In part 1, we noted the water vapour that has been detected venting from the Jovian Moon Europa and the Saturnian Moon Enceladus. Since then, we have noted additional stories about subterranean water on another Saturnian Moon -
Mimas and two more Jovian Moons
Ganymede and
Callisto (although the latter was first posited in 2001).
Gravitational Binding Energy
One objection to the GPEE theory might be the consideration of Gravitational Binding Energy (GBE). If one considers that energetic processes were in play during the formation of the earth and the earth coalesced from smaller pieces, then the force of gravity had to eventually overcome the forces/energies which were present in this collection of pieces. It is generally considered that the coalescing of the earth created large amounts of heat – as the kinetic energy of pieces of material colliding with each other was converted into heat. The overall energy should then be related to the GBE. The
GBE for a sphere is given by
However, if the original earth’s radius was only about half of the present radius, the actual mass as only 10% or 15% of the accepted mass, then the gravitational binding energy may have been as much as 50 times lower than the accepted figure. i.e. if we assume the accepted mass of the earth is 20 units and the radius is 10 units then the calculation above will be:
We are suggesting the mass is actually 2 units and the radius (when the earth was formed) is 5 units, hence the above formula would become
This means that the formation of the earth may have involved much 0.8/40 = 1/50 of the heating that most scientists would accept. This, again, lends support to the idea that the earth could have had a cool core – an ice core, even, as we have already proposed.
The Future…?
If venting of water increases ahead of expansion, then we would predict rising sea levels – not because the Polar Ice caps are melting, but because more water is being forced out from under the mantle due to the gas expansion. We might therefore be given to wonder will all the material in the mantle, ultimately, be “extruded” to form ocean floor? Will all the water be forced to the surface to form oceans with four times their present volume now? Or, will the oceans’ depths remain constant or even go down as the earth itself continues to expand, and the water is therefore spread over a larger surface area?
Will the CMF of the earth get even closer to the surface, causing an increase in the force of gravity at the surface – resulting smaller sized mammals, smaller sized humans and so on? Will the crust eventually become so thin that it is no longer viable, and the planet eventually explodes? At this point, one is reminded of
Tom Van Flandern’s Exploded Planet Hypothesis…
Conclusions
In addition to the conclusions drawn in part 1 we can add.
1. Gravitational measurements taken by various studies are not anomalous (as always stated), but caused by an offset CMF, within a gas filled expanded earth. i.e. the reduction in the acceleration due to gravity with increasing altitude is also that better predicted by the GPEE model than the accepted “iron core” model.
2. Given much lower earth mass than the accepted model, all other computations for the mass of all other bodies in our solar system need to be revised down by almost 90%.
3. The abiotic production of oil is due to the presence of methane in the core being forced under pressure through the mantle into low regions in the crust. The hot, pressurised water present in the transitional zone is then an ideal region in which chemical reactions – forming all kinds of organic compounds – can take place. This process is happening all the time – as the earth is still expanding.
4. The increasing distance between earth and moon is due to venting of gas/water through the moon's shell creating a loss of mass. The moon has an insufficient force of gravity to retain an atmosphere - so it has lost mass, while the earth’s mass has not changed much.
5. Using a solid earth theory of earth expansion if weight at sea level now is 100kg then pre expansion using an earth with a radius of 59% of that now then gravity pre-expansion would be 59%, (59kg) of that now also. This would not low enough to allow the giant flora and fauna pre- expansion.
6. Although not easily researched (due to secrecy) it would seem that the US and USSR struggled to achieve the desired orbits and trajectories in the early days of space exploration. This may have been due to earth's CMF not being at earth's centre and its considerably lower mass. To explain the now routine deployment of satellites are calculated a “fix” may have been applied.
7. An offset CMF on the moon would be even more disruptive to lunar orbiters than earth’s offset, due to the aggregation of mass on the earth facing side of the moon.


